Excel to PowerPoint Automation
Excel to PowerPoint Automation helps businesses turn Excel data, charts, tables, dashboards, and reports into professional PowerPoint presentations with less manual work. It is useful for teams that prepare weekly reports, monthly reviews, sales presentations, financial summaries, KPI updates, and management slides on a regular basis.
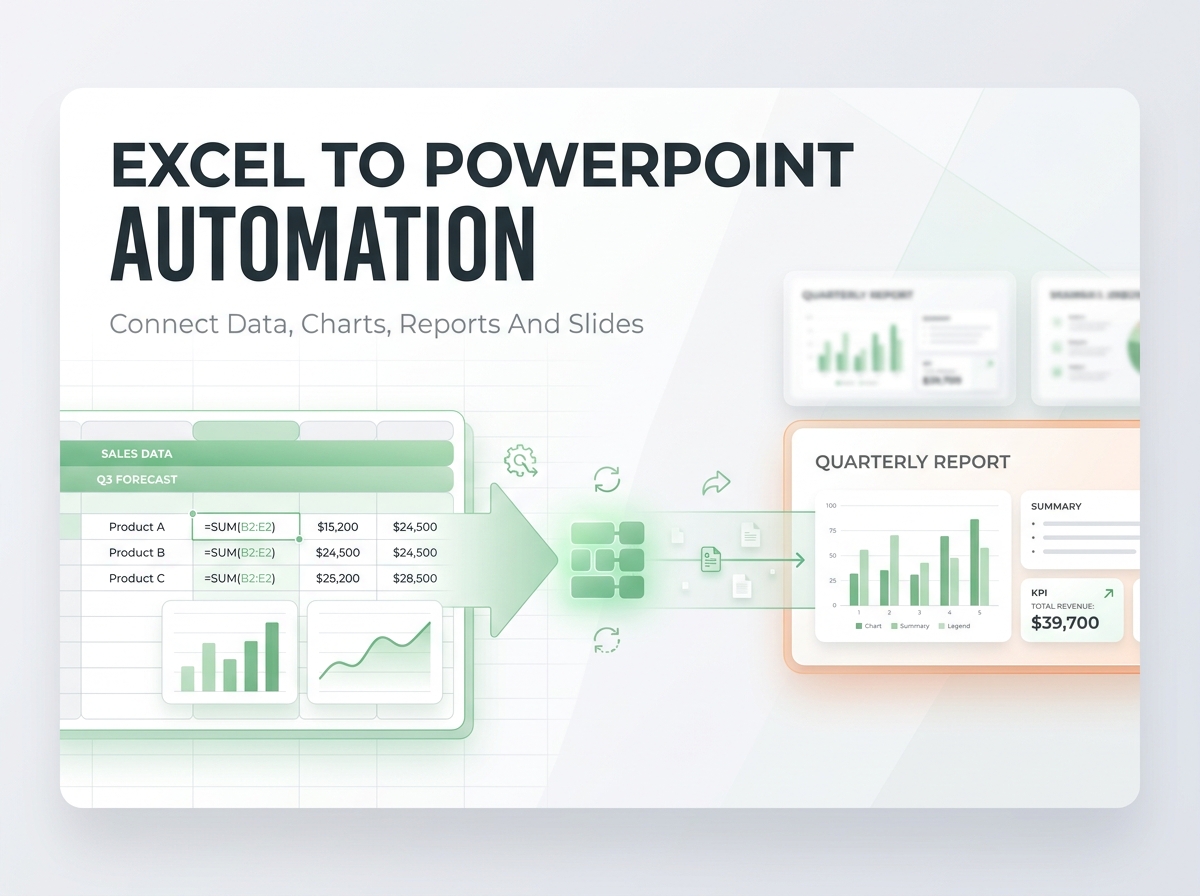
What Is Excel To PowerPoint Automation
Excel to PowerPoint automation is the process of using Microsoft Excel to create, update, or control PowerPoint presentations automatically. Instead of copying charts, tables, dashboards, and numbers from Excel and pasting them into slides one by one, automation can do the work for you.
This is useful when your business creates regular reports, weekly presentations, monthly management slides, sales performance decks, financial summaries, project updates, or KPI reports.
With Excel to PowerPoint connection, your Excel workbook becomes the main source of data, and PowerPoint becomes the final presentation format. This makes reporting faster, cleaner, and more consistent.
Why Businesses Need Excel To PowerPoint Connection
Many businesses prepare the same type of presentation again and again. The numbers change, but the layout stays the same. This creates a lot of repeated work.
For example, a manager may update sales numbers in Excel every month and then manually copy those numbers into PowerPoint. This takes time and can easily create mistakes.
Excel to PowerPoint automation helps solve this problem by connecting your Excel data with your presentation slides. When the data changes in Excel, your PowerPoint report can be updated faster with fewer manual steps.
This is especially helpful for teams that depend on accurate reporting and professional presentations.
Common Tasks You Can Automate
Excel to PowerPoint automation can be used for many business tasks. It can help you create slides from Excel data, update charts, insert tables, generate presentation files, and export reports for meetings.
Common automation tasks include:
Creating PowerPoint slides from Excel data
Copying Excel charts into PowerPoint
Sending Excel dashboard screenshots to slides
Updating PowerPoint tables from Excel
Creating monthly business reports
Generating sales presentation decks
Preparing financial summary slides
Creating KPI presentation reports
Exporting Excel ranges as images into PowerPoint
Making client ready presentation files
This type of automation is useful for finance teams, sales teams, operations teams, consultants, analysts, project managers, and business owners.
How Excel Data Connects With PowerPoint
There are different ways to connect Excel with PowerPoint. The best method depends on how your report works and how often it needs to be updated.
One simple method is to copy and paste Excel charts into PowerPoint as linked objects. This allows PowerPoint to keep a connection with the Excel file.
Another method is to use Excel VBA Macros. With VBA, Excel can open PowerPoint, create slides, insert charts, add text, paste tables, and save the final presentation automatically.
For more advanced business reporting, a custom automation system can be created where Excel works as the data source and PowerPoint works as the final output.
This means you can keep your numbers in Excel and generate professional PowerPoint reports with fewer clicks.
VBA Code Example To Send Excel Chart To PowerPoint
Below is a simple Excel VBA example that copies a chart from Excel and pastes it into a new PowerPoint presentation.
Sub ExportChartToPowerPoint()
Dim pptApp As Object
Dim pptPresentation As Object
Dim pptSlide As Object
Dim excelChart As ChartObject
Set excelChart = ThisWorkbook.Sheets("Dashboard").ChartObjects("Chart 1")
On Error Resume Next
Set pptApp = GetObject(, "PowerPoint.Application")
If pptApp Is Nothing Then
Set pptApp = CreateObject("PowerPoint.Application")
End If
On Error GoTo 0
pptApp.Visible = True
Set pptPresentation = pptApp.Presentations.Add
Set pptSlide = pptPresentation.Slides.Add(1, 12)
excelChart.Copy
pptSlide.Shapes.PasteSpecial DataType:=2
pptSlide.Shapes(1).Left = 80
pptSlide.Shapes(1).Top = 100
pptSlide.Shapes(1).Width = 550
pptSlide.Shapes(1).Height = 320
MsgBox "Chart exported to PowerPoint successfully"
End Sub
This code opens PowerPoint, creates a new presentation, adds a blank slide, copies a chart from the Excel sheet named Dashboard, and pastes it into PowerPoint.
This is only a basic example. A full Excel to PowerPoint automation system can include multiple slides, custom titles, updated tables, formatted charts, client names, dates, comments, and saved presentation files.
Real Life Example Of Excel To PowerPoint Automation
Imagine a sales company that prepares a monthly performance presentation for management. The sales team keeps all data in Excel, including region wise sales, product performance, target achievement, monthly revenue, and customer growth.
Before automation, one employee spends several hours every month copying charts from Excel, pasting them into PowerPoint, adjusting slide layout, updating titles, checking numbers, and saving the final file.
With Excel to PowerPoint automation, the employee only updates the Excel file and clicks one button. The Macro creates a PowerPoint presentation with updated charts, sales summary, KPI cards, tables, and monthly performance slides.
This saves time, reduces copy paste errors, and gives management a professional report in a consistent format every month.
Best Practices For Excel To PowerPoint Automation
A good automation system should be clean, reliable, and easy to maintain. Before creating the automation, your Excel file should be properly structured.
Your data should be arranged in clean tables, chart names should be clear, formulas should be accurate, and the PowerPoint layout should be planned before coding starts.
It is also better to use a fixed report format if you need repeated presentations. This allows the automation to update the same slide structure with new data each time.
For best results, keep your Excel source file organized and avoid unnecessary manual changes in the PowerPoint file after automation is created.
Conclusion
Excel to PowerPoint automation is a powerful way to save time, improve reporting accuracy, and create professional business presentations faster. It helps businesses turn Excel data, charts, tables, dashboards, and reports into ready to use PowerPoint slides with less manual work.
Whether you need a simple chart export, a monthly management report, a financial presentation, a KPI dashboard deck, or a complete Excel to PowerPoint automation system, this solution can make your reporting process faster and more professional.
At Excel Expert Help, we can build custom Excel to PowerPoint automation tools based on your exact report format, Excel file, and presentation needs.
